IELTS Academic Writing Task 1
IELTS Academic Writing Task 1 asks you to describe visual information — a graph, table, chart or diagram — in at least 150 words in about 20 minutes. You report the key features in full sentences, and you never give your own opinion here.
On this page14 sections · tap to jump
- 01By the end of this page you can…
- 02IELTS Academic Writing at a glance
- 03What Task 1 can ask you to describe
- 04How the four marking criteria work
- 05A simple four-paragraph structure
- 06Useful language for Task 1
- 07A sample Task 1 answer
- 08Example sentences
- 09How to say it
- 10Usage notes
- 11Practice
- 12Quiz
- 13Recap cheat-sheet
- 14How to prepare with this course
Level: B2. Task 1 is the shorter of the two IELTS Academic Writing tasks. You are given one piece of visual information and you describe what it shows — clearly, accurately and in your own words. This page explains the format, the marking, a reliable structure and a full sample answer, then points you to the course pages that build the skill.
By the end of this page you can…
…recognise every Task 1 prompt type, plan a four-paragraph answer, use the right language for trends and comparisons, and avoid the mistakes that cost the most marks.
IELTS Academic Writing at a glance
The Writing paper lasts 60 minutes and has two tasks, both of which you must complete (IELTS). Task 1 is the smaller job:
| Feature | Task 1 |
|---|---|
| What you do | Describe a graph, table, chart or diagram in your own words |
| Minimum length | 150 words |
| Suggested time | About 20 minutes |
| Weighting | Counts less than Task 2 toward your Writing band |
| Answer form | Full sentences — never notes or bullet points |
Because Task 2 contributes twice as much as Task 1 to the Writing score (IELTS), spend about 20 minutes here and leave 40 for the essay.
What Task 1 can ask you to describe
In Task 1 you have to describe some visual information — a graph, table, chart or diagram — and all the information you need is in the image itself (IELTS). The common prompt types are:
- Line graph — change over time (describe the trends).
- Bar chart — compare quantities across groups.
- Pie chart — proportions of a whole (percentages).
- Table — numbers you must group and summarise.
- Process diagram — stages of how something is made or works (describe in sequence).
- Map — how a place changed, or two places compared (describe by position).
A line, bar, pie or table is about data. A process or map is about sequence or position, so you do not talk about trends — you describe stages or locations in order.
How the four marking criteria work
A certificated examiner marks each task on four criteria, weighted equally (IELTS):
| Criterion | What it rewards in Task 1 |
|---|---|
| Task achievement | Covering the data accurately, with a clear overview of the main features |
| Coherence and cohesion | Logical order and smooth linking of ideas |
| Lexical resource | A range of accurate, appropriate vocabulary |
| Grammatical range and accuracy | Varied, correct sentence structures |
A simple four-paragraph structure
- Introduction (1 sentence) — paraphrase the prompt: say what the visual shows, where and when.
- Overview (1–2 sentences) — the two or three biggest features, with no specific numbers.
- Detail paragraph 1 — the first group of data, with figures.
- Detail paragraph 2 — the second group, with figures and comparisons.
For a process or map, keep the introduction and overview, then replace the two detail paragraphs with the stages in order (process) or before/after description (map).
Useful language for Task 1
| Job | Language |
|---|---|
| Introduce | The graph shows… / The chart illustrates… / The table gives figures for… |
| Overview | Overall, … / The most striking feature is… / In general, … |
| Rising | rose, increased, climbed, grew — a sharp rise, a steady increase |
| Falling | fell, decreased, declined, dropped — a slight fall, a steep decline |
| No change | remained stable, stayed constant, levelled off |
| Compare | far higher than, roughly double, the same as, slightly below |
| Approximate | about, just over, nearly, around, approximately |
A sample Task 1 answer
This answer gives an introduction, a clear overview, grouped detail with figures, and a closing comparison — the shape examiners look for.
Example sentences
Press play and copy the rhythm. These are the lines you will reuse across almost any Task 1 answer.
- The graph shows the number of visitors to three museums over ten years.A clear introduction that paraphrases the prompt.
- The table gives figures for household spending in four countries.Introducing a table.
- Overall, sales rose steadily across the whole period.An overview sentence stating the big picture.
- The most striking feature is the sharp rise in online orders.Highlighting the single biggest feature.
- Car use increased sharply between 2000 and 2005.Describing a sharp upward trend with a time frame.
- The number of letters sent fell steadily after 2010.Describing a steady fall.
- Unemployment remained stable at around five per cent.Describing no change.
- Spending on housing was far higher than spending on food.Making a comparison between two figures.
- The figure for cycling was roughly double that for walking.A proportional comparison.
- Just over a quarter of the group chose train travel.Using an approximation with a fraction.
- In the first stage, the raw cotton is cleaned and sorted.Describing the first step of a process.
- The cleaned fibre is then spun into thread.Linking the next step with 'then'.
- By 2015, the car park had been replaced by a garden.Describing a change on a map over time.
- The gap between the two groups widened considerably.Summarising a growing difference.
- The figures are measured in thousands of tonnes.Naming the unit, so your detail is accurate.
Quick recap before you practise.
How to say it
A few words in trend language trip up English learners — copy the stress.
- steadily has three beats, stress on the first: STED-i-lee.
- approximately is uh-PROK-si-mit-lee, stress on the second beat.
- considerably is kuhn-SID-er-uh-blee, stress on the second beat.
- figure is FIG-er in British English (the gu is a hard g).
Usage notes
- No opinions. Task 1 is a report. Save phrases like I think for Task 2.
- Tenses follow the dates. Past data takes the past simple; a process diagram with no dates takes the present simple (often passive: the beans are roasted).
- Paraphrase the prompt in your introduction — copying it word for word is not rewarded.
- Round sensibly. Just over 250,000 reads better than a long exact number lifted from the axis.
Practice
Task 1 practice
Try each one, then press Check. No sign-up, nothing is sent anywhere — it all runs in your browser.
Hint: the minimum length
Show answer
150 — The minimum for Task 1 is 150 words.
4 Match each prompt type to how you describe it.
- Line graph
- Pie chart
- Process diagram
- Map
Show answer
- Line graph → trends over time
- Pie chart → proportions of a whole
- Process diagram → stages in sequence
- Map → changes by position
Data visuals need trends or proportions; process and map need sequence or position.
5 Put a four-paragraph Task 1 plan in the right order.
Show answer
Introduction Overview Detail group 1 Detail group 2 — Introduce, give the overview, then two grouped detail paragraphs.
Hint: past simple of an upward verb
Show answer
rose — Rose, increased, climbed and grew all describe an upward trend.
Quiz
Task 1 quiz
12 questions · pick an answer and you'll see straight away if it's right.
-
Show answer
Describe visual information in your own words — Task 1 asks you to describe a graph, table, chart or diagram.
-
Show answer
60 minutes — The IELTS Writing paper lasts 60 minutes for both tasks.
-
Show answer
Two — There are two tasks and both must be completed.
-
Show answer
Task 2 — Task 2 contributes twice as much as Task 1 to the Writing score.
-
Show answer
150 words — You must write at least 150 words in Task 1.
-
Show answer
Handwriting neatness — The four criteria are task achievement, coherence and cohesion, lexical resource, and grammatical range and accuracy.
-
Show answer
The two or three biggest features, without specific figures — The overview summarises the main features and is quickly rewarded under task achievement.
-
Show answer
As stages in sequence — A process is described step by step in order, not as a trend.
-
Show answer
remained stable — Remained stable, stayed constant and levelled off all describe no change.
-
Show answer
Full sentences — Answers must be in full sentences, not notes or bullet points.
-
Show answer
Paraphrase it in your own words — Paraphrasing shows lexical resource; copying word for word is not rewarded.
-
Show answer
Past simple — Dated past data takes the past simple; a dateless process often takes the present simple passive.
Recap cheat-sheet
| Point | Task 1 |
|---|---|
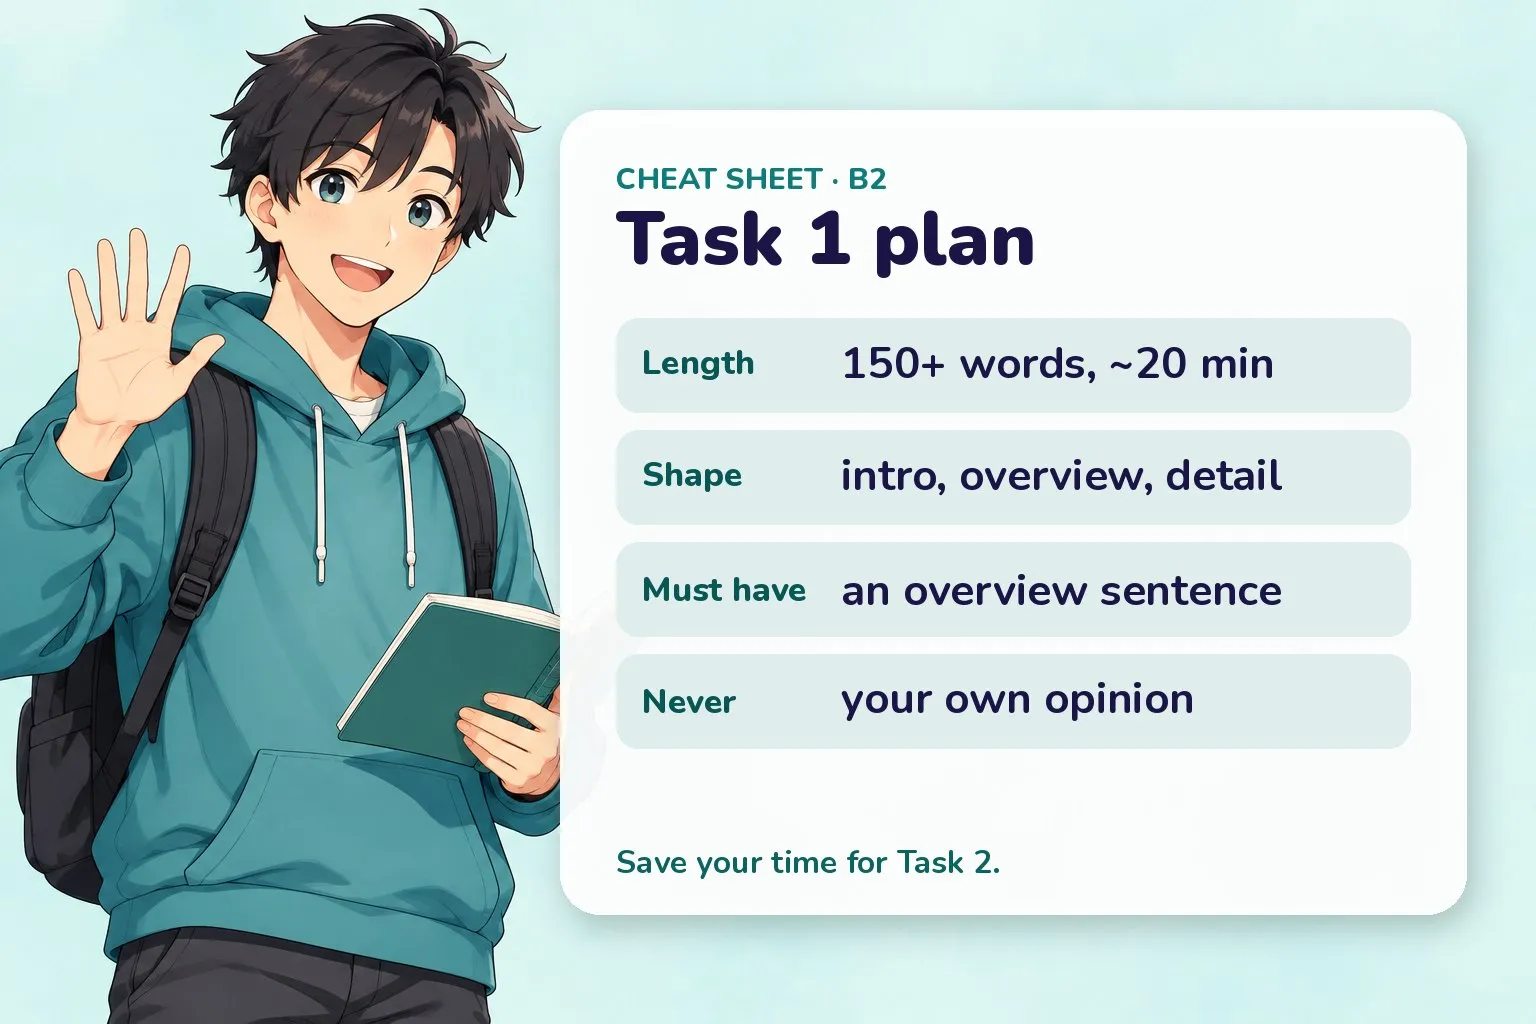
| Length | at least 150 words |
| Time | about 20 minutes |
| Weighting | less than Task 2 |
| Shape | intro + overview + 2 detail paragraphs |
| Must have | an overview of the main features |
| Never | your opinion, notes or bullet points |
How to prepare with this course
- Learn the trend and comparison language in Describing trends and data and Linking words for writing.
- Sharpen comparisons with Comparative adjectives and process descriptions with The passive (all forms).
- Build exam vocabulary with Academic word list 1.
- Rehearse under time with the Writing practice guide.
Next
- Start here: English Exams: Which One & How to Prepare
- Build the language: Describing trends and data
- Rehearse writing: Writing practice guide
- New here? Start with Start Learning English Here
All English exams topics
Vocabulary, pronunciation, phrases, practice and exam help, ordered by level. Pick a topic and go straight to it. New lessons go live every day, so topics marked Coming soon fill in over the next weeks.
Exams
A2 1 topics · 1 ready
B1 6 topics · 6 ready
B2 12 topics · 12 ready
- 08 IELTS Reading: Format & Strategies
- 09 IELTS Academic Writing Task 1 You are here
- 10 IELTS Writing Task 2 (Essay)
- 11 IELTS Speaking: Parts 1-3
- 12 TOEFL iBT Overview: Format & Scoring
- 13 TOEFL Reading Strategies
- 14 TOEFL Listening Strategies
- 15 TOEFL Speaking Tasks
- 16 TOEFL Writing (incl. Integrated)
- 17 B2 First (FCE) Overview
- 18 Exam Essay & Writing Skills
- 19 Exam Speaking Strategies